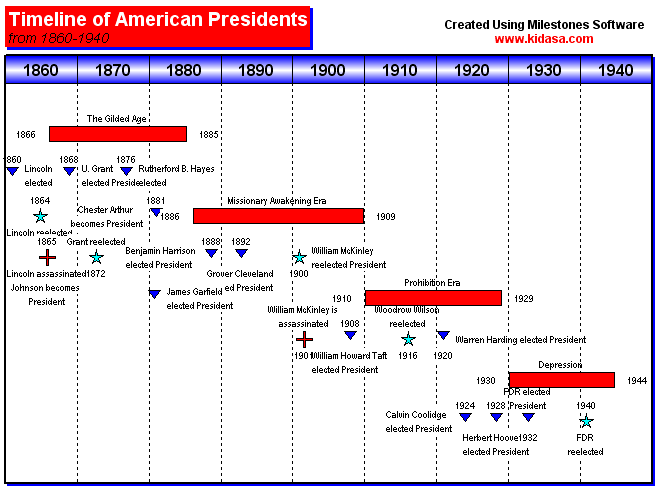
Gantt charts can be used for anything – this one looks at a timeline for American Presidents
An estimated 57% of all projects fail due to a breakdown in communications. To this end, many project managers use Gantt charts to formulate a visual representation of their project’s progress and negotiate around the many communications-related issues that could derail it.
Gantt charts – charts that represent the amount of work that needs to be done during particular periods of time, are used to visually lay out a project schedule. The concept was first created by polish engineer Karol Adamiecki in the early-20th century, however the name is attributed to American engineer, Henry Gantt, who tweaked and popularized the chart in the West.
Over the course of many years, professionals tweaked the Gantt chart into the format used today. It is now implemented across many different sectors and used to help manage organizations with deadlines, shifts and complicated production processes.
Visually identify tasks
Gantt charts visually depict the tasks that need to be completed and at what point they need to be finished for a project to move forward. However, they are pretty much useless unless they contain well-thought out data. Project managers need to identify all of a project’s essential tasks and assess the order of completion as a first step.
Next, project managers need to establish how tasks relate to each other:
- sequential – a task needs to be finished before the next one starts
- parallel – they can run at the same time as another task
To optimize delivery times, project managers should try to schedule as many parallel tasks as possible.
Once established, project managers can draw out the charts (this is usually done via the creation of an x-axis with dates and a y-axis with task order -the final product generally looks like descending stairs).
Naturally, the hand-drawing of Gantt charts is a somewhat resource-heavy activity – and out of the question for busy project managers. Thankfully, new project management software enables project managers to organize, create and share Gantt charts across their teams.
Off Peak Training solutions can help you to standardize the way your company does business – creating efficiency, productivity and a common culture among work teams. Find out more about our all-inclusive online course for just $29 per month: